International Comparators for the West Midlands: Identifying and learning from city-regions most similar to the West Midlands
International Comparators for the West Midlands
Download the International Comparators for the West Midlands: Identifying and learning from city-regions most similar to the West Midlands report in PDF format
International Comparators: Interactive Power BI Report
Compare and contrast city-regions and their similarity and productivity to the West Midlands Combined Authority area
Executive summary
Typically, UK city-regions have been compared against London, with prescriptions for UK productivity focused on a London-centric model of productivity growth. This work seeks to develop this approach by identifying international city-regions which, in the past, bore the closest resemblance to the West Midlands Combined Authority (WMCA) area in terms of its demographics, economic composition, and administration; but which have now outpaced and outperformed productivity growth rates in other regions in their own countries since.
This work has consisted of a four stage process consisting of a literature review, quantitative analysis, productivity analysis, and a five-factor qualitative analysis. This has resulted in the identification of a number of city-regions from which the WMCA could make useful comparisons and draw useful lessons.
The four identified city-regions are: Lille, France; Greater Porto, Portugal; Saxony, Germany; and Lombardy, Italy. Additionally, four city-regions in Mexico and Japan have been identified. Following further discussions with colleagues in Mexico and Japan, we will identify two additional comparator city-regions: either Guadalajara or Monterrey in Mexico, and Sapporo or Okayama in Japan.
Having identified this cohort of comparable international city-regions, further work will be undertaken to explore those factors that have facilitated more rapid productivity growth with a view to learning lessons for the West Midlands.
This study aimed to identify international city-regions that once closely resembled the West Midlands Combined Authority (WMCA) area in terms of demographics, economic composition, and administration, but have since shown significant growth in relation to other regions in their respective countries, offering valuable lessons for the WMCA city-region.
Having identified this cohort of comparable international city-regions, further work will be undertaken to explore those factors that have facilitated more rapid productivity growth with a view to learning lessons for the West Midlands.
This report forms part of West Midlands Futures, a process and conversation started in autumn 2023 about the future of the West Midlands. It is a process to generate a distinctive and shared story about our place in the national and global economy. The first phase of this work, called “clarify”, identified a set of ‘big questions’ and ‘grand challenges’ through desktop research and stakeholder interviews. This report is part of the “Understand” phase in which we are developing a deep evidence base for future economic strategy.
UK city-regions are typically compared to London and prescriptions for productivity growth are typically focused on a London-centric model of growth. This approach overlooks the unique economic opportunities of other city-regions and does not consider London’s special status as a capital, and a global city with an international financial sector. Copying London’s model for the WMCA area is not only impractical, but it ignores the specific strengths and challenges in the WMCA city-region.
By identifying a cohort of more similar international city-regions, the intention is to carry out a comparative analysis which identifies the reasons why such similar city-regions have seen such relative success within their national contexts and to identify lessons for the West Midlands.
These lessons will feed into the development of the forthcoming West Midlands Growth Plan, the West Midlands theory of growth and subsequent development of economic strategy and policy in the West Midlands as part of West Midlands Futures.
A multi-stage quantitative and qualitative approach was undertaken. These are:
- Literature review – existing comparative studies
- Quantitative analysis – distance measure
- Productivity analysis – regional productivity gap compared to the national average
- Five factor qualitative analysis – incorporating polycentricity, industrial composition and median age
Analysis
A literature review was conducted on existing English-language research that attempted to draw comparisons between international city-regions relevant to the research question. This review involved internet searches and consultations with national and international contacts and networks. It revealed that few prior published works have sought to address this topic.
The most relevant report is a report from GLA Economics in 2016 which produced the London in Comparison with other Global Cities report.[1] The purpose of GLA’s work was to compare “London’s economic structure with other global cities, particularly looking at its economic output, employment and productivity”. Comparator cities were selected based on their perceived nature as “both traditional and emerging cities that compete with London”. Selected cities included New York, Paris, Berlin, Tokyo, Singapore, Hong Kong, Shanghai, and Dubai. The report begins with an economic comparison before seeking to explain any differences between London and the other cities. This was, by far, the most appropriate comparator to the work this study attempts to answer – it looked at how the cities compared in 2006 across output, employment and productivity, and seen how these factors changed in each of those cities between 2006 and 2014.
There were several other works with elements which are comparable:
In 2012, the Centre for Cities produced a European Comparator City Report: York which compared York to cities in mainland Europe of a similar size population – that is, of 100,000-300,000 people.[2] The purpose of the report was to analyse York’s competitiveness in terms of human capital, and entrepreneurialism. While York was ranked against other cities, there was no attempt to take a more longitudinal approach to comparators nor were reasons for success identified.
In 2023, the Resolution Foundation produced a report entitled Turnaround Cities. This was concerned with understanding how large cities, which had struggled to thrive following the transition to a post-industrial economy, could reverse their fortunes.[3] Cities were selected because they were known by people in their own countries to have been in a bad condition but turned it around. The research examined seven case study cities and sought to find the necessary ingredients for a city to reverse long-term economic underperformance. Key insights included the need for complementarity between urban and economic development strategies, holistic economic promotion strategies, building on existing economic strengths, the importance of local leadership, long-term and stable funding, and collaboration among a diverse set of actors. This provided useful insights in terms of the factors leading to recovery, but its purpose was not to identify international comparator city-regions.
In 2024, the West Midlands Growth Company (an arms-length body of the West Midlands Combined Authority and its constituent local authorities) worked with Connected Places Catapult and the Business of Cities on a report entitled Innovation in the West Midlands: International Prospects and Place Partners. This report draws international comparisons and aims to identify city-regions which have complementary economies to the WMCA area – but it differed substantially from the purpose of this work to identify places with similar economic trajectories. The primary aim of the publication was to identify potential international partners for the West Midlands “to build relationships that have especially high potential to last over the long term and create mutual benefit” from an innovation perspective.[4] International comparators were compared along three ‘core dimensions’: shared identity, compatible strengths, and a desire to improve. The dimensions were derived from “innovation trends, performance indicators, and global strategies of other forward-thinking city-regions”.[5] Potential partners that aligned with the West Midlands along all three dimensions were Ulsan, Minneapolis-Saint Paul, Saxony, Hyderabad, Lyon, and Rhine-Ruhr.
Consequently, works comparing UK city-regions with international comparator city-regions are limited – and reflected limited data availability – a matter noted by nearly all the above publications.
[1] GLA Economics (2016). London in comparison with other global cities.
[2] Centre for Cities (2012). European Comparator City Report: York.
[3] Resolution Foundation (2023). Turnaround Cities: How post-industrial cities around the world have transformed their economies.
[4] Connected Places Catapult, The Business of Cities, and the West Midlands Growth Company (2024). Innovation in the West Midlands: International Prospects and Place Partners – draft version 7, p.11.
[5] Connected Places Catapult, The Business of Cities, and the West Midlands Growth Company (2024). Innovation in the West Midlands: International Prospects and Place Partners – draft version 7, p.10.
The quantitative analysis aimed to identify city-regions worldwide that, 10-15 years ago, most closely resembled the WMCA area in terms of demographics, economic composition, and administration.
The main source of data available for international comparisons are data from the United Nations (UN); data from the Organisation for Economic Co-operation and Development (OECD), and data from the European Union through Eurostats. As data at a cities and regions level is not available via the UN, and the next best available source was the OECD. There are limitations with OECD data as it focuses on OECD countries, however the research team felt this was a reasonable limitation given the need to compare places similar to a developed area such as the WMCA area. As data published by the OECD was not always available at the WMCA area geography, the research team undertook some data processing and data preparation work to create a ‘WMCA’ figure for each metric as well as selected polycentric urban areas.
The OECD’s city statistics dataset was chosen as this was built up on ‘functional urban areas’ (FUA) which was an appropriate geography for comparison with other city-regions. Note that due to differences in how international organisations define ‘city-regions’ or ‘functional economic areas’ – particularly outside the European Union, there are limitations with missing data issues with the OECD city statistics dataset. The research team were able to fill these gaps using calculations from other variables or obtaining the data from additional sources. This is by no means a perfect exercise – for instance, our own ‘virtual’ WMCA includes swaths of the wider region resulting in a population of around 4.6 million, rather than the official 2.9 million population of the seven metropolitan districts of the constituent WMCA.
A basket of metrics was selected, focus not only on ‘traditional’ economic growth metrics, but also a consideration of the WMCA’s socioeconomic objectives set out by the West Midlands Inclusive Growth fundamentals, which are, in turn, aligned to the United Nations Sustainable Development Goals.
The metrics chosen were:
- Population
- Population density (inhabitants per square kilometres)
- Total land area (in square kilometres)
- Urbanised area (built-up area or land for urban use in km²)
- Urbanised area per capita (square metres per capita)
- Employment rate (employment of people aged 15-64 as a percentage of population aged 15-64)
- Unemployment rate (unemployment of people aged 15-64 as a percentage of population aged 15-64)
- Labour productivity (GDP per worker in USD at constant prices, at constant purchasing power parity [PPP], with a base year of 2015)
- National labour productivity (GDP per worker in USD at constant prices, at constant purchasing power parity [PPP], with a base year of 2015)
- National population density (population per square kilometres)
A distance measure was calculated using the following method:
∑ √ (Xi − XWMCA / 𝜎) ²
Where, for each metric:
- Xi is the metric value for a selected city-regions i;
- XWMCA is the value for the WMCA area; and
- σ is the standard deviation of the variable.
In effect – this generates a ‘distance measure’ for each variable of each city-regions – which can then be aggregated to generate an average distance score as to the ‘distance’ (or similarity) for each city-regions to the WMCA area.
These scores were then normalised, so that a figure of “100” means a place is identical to a chosen place in a chosen year.
The year 2010 was picked as this represented almost 15 years ago, in line with our goal to compare our progress with somewhere 10-15 years ago. Taking WMCA (2010) as 100, the place that is most similar to the WMCA is Manchester, with a score of 92.33. The place that is most dissimilar to the WMCA is Los Angeles (score of 0.71), followed by Tokyo (17.71) and New York (18.14).
Now solely considering places within the UK – the places most similar to WMCA (2010) are Manchester (92.33), followed by Liverpool (89.71), Sheffield (88.24), Leeds (87.82). London is amongst the most dissimilar places to the WMCA, with a score of 68.56.
Excluding the UK, places that are most similar to the WMCA (2010) tend to be places in Germany and Japan.
The places in Germany that bore strongest resemblance to WMCA (2010) are Ruhrgebiet (87.65); Berlin (85.14), Koln (84.60), Monchengladbach (83.42) and Aachen (83.37).
The places in Japan that were most similar to the WMCA (2010) were Sapporo (86.73), Fukuoka (86.56), Kitakyushu (86.01), Sendai (85.53) and Nagasaki (83.76).
Excluding UK, Germany, and Japan, other similar places included Milano, Italy (83.45), Vancouver, Canada (83.28), the polycentric European region of Aachen/Heerlen/Liege/Maastricht (83.01), Gimhae, South Korea (82.25), and Porto, Portugal (82.21).
However, given that capital cities have unique economic drivers which cannot be replicated in other, non-capital regions; and that population has a disproportionate effect on economic possibilities, a decision was taken to exclude capital cities from the analysis, and focus on city-regions with a population of between 1.5 million and 5 million inhabitants as of 2010. This then resulted in the following list of 61 city-regions, from most similar to least similar to the WMCA (2010) where 100 = closest to WMCA, and 0 = furthest from WMCA.
|
Place |
Distance from WMCA (100 = closest) |
|
Fukuoka, Japan |
86.73 |
|
Sapporo, Japan |
86.56 |
|
Sendai, Japan |
85.53 |
|
Köln, Germany |
84.60 |
|
Milano, Italy |
83.45 |
|
Vancouver, Canada |
83.28 |
|
Gimhae, Korea |
82.25 |
|
Torino, Italy |
82.04 |
|
Guadalajara, Mexico |
81.60 |
|
Greater Porto (Porto, Braga, Guimares), Portugal |
81.57 |
|
Okayama, Japan |
80.65 |
|
Hamburg, Germany |
80.59 |
|
Barcelona, Spain |
79.69 |
|
Stuttgart, Germany |
79.44 |
|
Lyon, France |
79.00 |
|
Frankfurt am Main, Germany |
78.89 |
|
Katowice, Poland |
78.66 |
|
Montreal, Canada |
78.30 |
|
Gwangsan, Korea |
78.10 |
|
Puebla, Mexico |
77.68 |
|
Athina, Greece |
77.33 |
|
Tijuana, Mexico |
76.97 |
|
Marseille, France |
76.74 |
|
Rotterdam, Netherlands |
76.54 |
|
Monterrey, Mexico |
76.00 |
|
Toluca, Mexico |
75.45 |
|
Napoli, Italy |
74.31 |
|
Valencia, Spain |
74.07 |
|
München, Germany |
73.93 |
|
Greater Melbourne, Australia |
73.38 |
|
Greater Sydney, Australia |
73.04 |
|
Barranquilla, Colombia |
72.73 |
|
Greater Brisbane, Australia |
71.56 |
|
Dalseong, Korea |
70.23 |
|
Cali, Colombia |
69.82 |
|
Austin, United States |
68.75 |
|
Cuyahoga, United States |
67.47 |
|
Columbus, United States |
67.10 |
|
Milwaukee, United States |
66.58 |
|
Sevilla, Spain |
66.43 |
|
San Antonio, United States |
65.22 |
|
Orange, United States |
65.08 |
|
Portland, United States |
64.92 |
|
Charlotte, United States |
64.58 |
|
Cincinnati, United States |
63.85 |
|
Sacramento, United States |
63.69 |
|
Denver, United States |
61.93 |
|
San Diego, United States |
60.94 |
|
New Haven, United States |
60.94 |
|
Jackson (MO), United States |
60.75 |
|
St. Louis, United States |
60.72 |
|
Greater Perth, Australia |
60.64 |
|
Medellin, Colombia |
60.36 |
|
Minneapolis, United States |
59.98 |
|
Boston, United States |
59.95 |
|
Atlanta, United States |
56.49 |
|
Detroit (Greater), United States |
56.45 |
|
Indianapolis, United States |
54.77 |
|
Seattle, United States |
54.61 |
|
Phoenix, United States |
54.33 |
|
Las Vegas, United States |
35.90 |
In 2001, labour productivity per worker in West Midlands was USD$4,491 lower than the UK average (in constant 2015 prices) at USD$72,092 per worker in the West Midlands, compared to $76,583 for the UK. By 2006, this ‘gap’ has grown to USD$10,149 (that is, USD$72,166 per worker in the West Midlands compared to USD$82,315 per worker in the UK)– and this has, by and large, remained the same since. Since the Global Financial Crisis in 2007-2008, growth in the UK has been mostly driven by tradeable services in one sector – financial services – which can be seen in the difference between London and the rest of the country.
Consequently, since 2006, there has been no real divergence in productivity growth for the WMCA area compared to other places in the UK; just a consistent, long-term lack of growth in the WMCA area.
For the purposes of this study, merely resembling the West Midlands as it was in 2010 does not qualify a place as a suitable comparator. Given the purpose of this exercise is to explore relative rates of productivity, a further analysis was done to compare labour productivity in the region to nationally between the chosen year (2010) and the latest available data. 2010 was chosen – because, while there was no divergence within the UK before or after the financial crisis, there may be exogenous factors which influence this in other countries. For the latest available data 2019 was chosen because the pandemic from 2020 onwards significantly affected the dataset.
The steps taken for the regional productivity gap analysis are as follows:
- The difference in labour productivity between national and regional figures for each year was worked out by subtracting the regional figure from the national figure;
- The change between the chosen year (2010) and the latest year (2019 or earlier) was then worked out by subtracting the difference in labour productivity in the comparator year from the latest year;
- The resulting figure, either a positive figure (indicating that regional productivity between the latest year and the comparator year was better than national productivity) or a negative figure (indicating that regional productivity was poorer than national productivity over the time period), is then normalised to between -100 and 100.
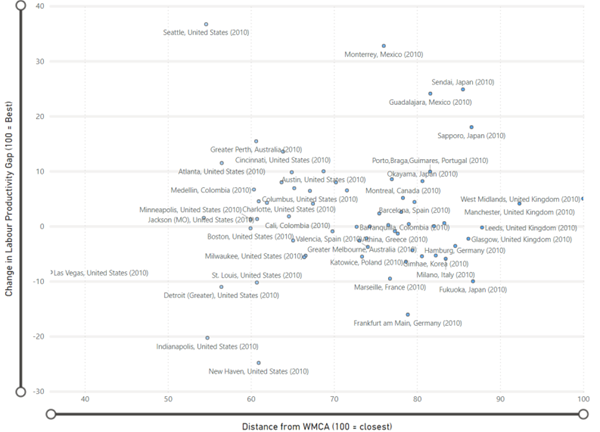
When considering the full dataset of 647 city-regions, 337 city-regions saw productivity growth greater than nationally between the chosen year (2010) and the latest available data (usually 2019, but occasionally 2018 or 2016); the remaining 310 saw growth that was no better than the national figure. WMCA saw a normalised value of 5 (a positive value) – a recognition that the gap in regional and national labour productivity narrowed slightly between 2010 and 2019.
The top five city-regions in terms of their productivity growth are: Cork, Ireland (100), San Francisco, United States (87), Wolfsburg, Germany (60), San Juan del Rio, Mexico (54), and Queretaro, Mexico (49).
As with the similarity analysis, it was important to focus on places of between 1.5 million and 5 million people, and that are not capital cities. Places that saw the greatest productivity growth compared to the national average Seattle, United States; Monterrey, Mexico; Sendai, Japan; Guadalajara (Mexico); and Sapporo (Japan).
However, places such as Seattle are rather different from the WMCA – making them less suitable as comparators.
The ten places that are most similar to the WMCA area and saw regional productivity growth that is greater than the national between 2010 and the latest available period are set out in the table below.
|
Place |
Distance from WMCA |
Change in Labour Productivity |
|
Sapporo, Japan |
86.56 |
17.98 |
|
Sendai, Japan |
85.53 |
24.85 |
|
Guadalajara, Mexico |
81.60 |
24.08 |
|
Greater Porto, Portugal |
81.57 |
9.92 |
|
Okayama, Japan |
80.65 |
8.19 |
|
Montreal, Canada |
78.30 |
5.13 |
|
Tijuana, Mexico |
76.97 |
8.54 |
|
Monterrey, Mexico |
76.00 |
32.76 |
|
Greater Brisbane, Australia |
71.56 |
6.50 |
|
Dalseong, Korea |
70.23 |
7.96 |
Productive analysis discussion
It may be argued that there are, perhaps, some unexpected results in this analysis. For instance, none of the ten places are city-regions in Germany or France. This discussion section sets out why this is the case in our particular analysis.
Germany
The place that is closest to the WMCA in 2010 is Ruhrgebiet; and the place that has seen regional productivity growth that is greater than the national is Leipzig.
In the West Midlands Growth Company report, Rhine-Ruhr and Saxony regions were identified as complementary economies to the West Midlands.
Ruhrgebiet: The closest match to Rhine-Ruhr in our international comparators study is the polycentric region of Ruhrgebiet. This region saw labour productivity grow (in constant 2015 prices) from US$78,210 in 2001 to $84,557 in 2010; peaking at $86,135 in 2011, but declining to $83,928 in 2019. Throughout the period 2001 to 2019, the Ruhrgebiet region’s productivity lagged the German average. But most importantly, while the region’s economy did grow, its regional growth rate lagged the national rate of growth between 2010-2019 largely on account of the rapid growth in cities of the former East Germany driving up the national average. Between 2001 and 2019, the region did see employment rate growth and its unemployment rate decreased – but unlike the West Midlands, it also experienced a decline in its population. Consequently, while the Ruhrgebiet region may be a complementary economy to the West Midlands as identified in the West Midlands Growth Company report, its below-average pace of growth means that it is not a place with lessons for the West Midlands.
Dresden and Leipzig-Halle, Saxony: The closest match for the Saxony region considered in our international comparators study is Dresden, and the Leipzig-Halle polycentric region. Dresden’s labour productivity increased from US$67,129 in 2001 to $70,937 in 2010, to $78,614 in 2019; while Leipzig-Halle saw an increase from US$70,866 in 2010 to $79,867 in 2019. Both regions saw productivity grow faster than the German average; population growth; employment growth; and reduced unemployment – and would be the sole German region that fit the criteria set out in this report. However, the OECD data and polycentric region literature treats Dresden and Leipzig-Halle as two separate functional economic geographies – and on their own, they are smaller than the cut-off of 1.5 million people chosen for our analysis – and thus they are not currently included in our list.
France
The place that is closest to the WMCA in 2010 is Lyon, followed by Lille.
Lyon: The West Midlands Growth Company analysis identified Lyon as a region as one complementary to the West Midlands. The region saw productivity growth from $98,911 in 2006 to $101,074 in 2010, and $107,698 in 2019. It has consistently outpaced national productivity in France. Its employment and unemployment rate has remained relatively static throughout the period considered. However, the rate of productivity growth in the region has not outpaced the national rate in France in 2010-2019, which would exclude it from our particular analysis.
There are three other city-regions that are all reasonably similar to the WMCA area, have labour productivity below the national average, but saw regional labour productivity since 2010 outpacing the French national average. These are:
- Clermont-Ferrand – however, its population is only 500k;
- Limoges – however, its population is similar to Coventry’s (300k);
- Geneve-Annemasse-Anncy-Cluses (France/Switzerland) – however, its population is slightly below the threshold of 1.5 million selected for our analysis;
- Mulhouse – however, its population is around 400k.
The next stage taken is to combine both the similarity score from the quantitative analysis stage 2 and the productivity analysis from stage 3 with a factor analysis. Three additional factors were chosen:
- geographical factor – to what extent does the city-region exhibit polycentricity;
- economic factor – to what extent are there similarities in the city-region’s industrial composition and history; and
- demographic factor – to what extent is the median age of the city-region similar to the West Midlands?
Together, a factor analysis was created against a selection of places that scored highly in both stage 2 and stage 3. For completeness, we have included some capital cities and other places excluded in the earlier stages. This is illustrated in the table below.
|
City
-Region |
Similarity |
Relative Productivity |
Polycentric? |
Industrial Composition |
Demographics - Median Age |
Overall score out of five |
|
WMCA |
100 |
5 |
Yes |
Manufacturing (automotive, advanced engineering) - accounts for larger share than nationally but declining in importance; services (finance, business, retail, education) |
35.9 |
5.0 |
|
Guadalajara |
81.6 |
24.08 |
Yes - 2x Brum sized (Guadalajara, Zapopan); 3x 500k cities |
ICT (Mexico’s Silicon Valley - software development), electronics manufacturing and design, automotives, and tequila production |
28.7 |
5.0 |
|
Lille |
79 |
0.03 |
Yes - Lille-Roubaix-Tourcoing |
Retail, logistics, manufacturing (automotive, textiles), and food processing |
29.1 |
4.5 |
|
Monterrey |
75.99 |
32.76 |
Yes - Monterrey-Apodaca |
Manufacturing (heavy industry - steel, cement, glass, automotive), and finance |
29.5 |
4.5 |
|
Greater Porto |
81.59 |
9.92 |
Yes |
Textiles, footwear, wine production (Port wine), tourism, and port activities; manufacturing accounts for 23% of Portugal industry; growing ICT and automotive sectors |
43.5 |
4.0 |
|
Meuse-Rhine |
83.04 |
6.27 |
Yes |
Logistics (due to the Rhine), manufacturing (automotive, metalworking), and chemicals |
41.2 |
4.0 |
|
Sapporo |
86.58 |
17.98 |
Yes - Sapporo-Ebetsu-Ishikari |
Food processing (especially beer), tourism (especially winter sports), and ICT |
44.3 |
4.0 |
|
Tijuana |
76.98 |
8.54 |
No |
Manufacturing (electronics, medical devices), and tourism |
27.8 |
4.0 |
|
Brescia |
78.72 |
6.91 |
Yes - if Milan-Bergamo added - HOWEVER productivity will go down |
Manufacturing (especially metalworking, machine tools, and automotive components), textiles, and agriculture |
42.1 |
3.5 |
|
Okayama |
80.67 |
8.19 |
Yes - made up of towns merged in the late 2000s |
Manufacturing (machinery, textiles, electronics), agriculture (fruit production), and transportation -- stronger on agriculture |
45.2 |
3.5 |
|
Saxony |
75.34 |
11.76 |
Yes |
Manufacturing (automotive, machinery), microelectronics, and tourism |
47.1 |
3.5 |
|
Brussels-Leuven |
72.35 |
1.83 |
Yes |
Government/EU institutions, services (finance, consulting), brewing, chemicals, textiles, steel, and food processing, pharmaceuticals, and technology (especially in Leuven) -- far stronger on government institutions |
36.6 |
3.5 |
|
Copenhagen |
77.27 |
4.1 |
Yes if we include Malmo |
Shipping/logistics, pharmaceuticals, renewable energy, ICT, life sciences, cleantech, logistics, and design -- stronger on shipping/logistics and energy production |
33.6 |
3.5 |
|
Grand Geneve |
78.46 |
9.18 |
Yes |
Banking and finance, trading and shipping, international organisations, luxury goods (watches), life sciences, tourism -- unique financial and luxury focus |
39.5 |
3.5 |
|
Lombardy |
82.5 |
-4.55 |
Yes |
Manufacturing (especially metalworking, machine tools, and automotive components), textiles, and agriculture |
42.1 |
3.0 |
|
Dalseong |
70.27 |
7.96 |
Yes - made up of seven regions |
Manufacturing (especially textiles and electronics), renewable energy, and agriculture -- much more rural than WMCA |
42.2 |
3.0 |
|
Greater Brisbane |
71.58 |
6.5 |
No |
Advanced manufacturing, mining, tourism, agriculture, and services (finance, education, health, logistics) -- far stronger on mining |
36.0 |
3.0 |
|
Montreal |
78.33 |
5.13 |
No |
Aerospace, ICT, finance, pharmaceuticals, and cultural industries |
40.6 |
3.0 |
|
Sendai |
85.55 |
24.85 |
No - next biggest area is 12% of Sendai |
Manufacturing (electronics, machinery), food processing especially fishing |
42.5 |
3.0 |
|
Ruhrgebiet |
87.64 |
-9.15 |
Yes |
Historically coal mining and steel, now diversified into manufacturing (machinery, automotive), logistics, and technology |
44.8 |
3.0 |
|
Gothenburg |
72.9 |
2.79 |
No |
Automotive, manufacturing, shipping/logistics, services (finance), and associated R&D |
40.6 |
2.5 |
|
Krakow |
75.03 |
3.09 |
No |
Tourism, ICT, business processes outsourcing, and manufacturing (especially machinery and metal products) -- stronger on tourism and outsourcing |
34.2 |
2.5 |
|
Lyon |
79.2 |
0.38 |
No |
Manufacturing (chemicals, pharmaceuticals), services (finance, business services), and biotechnology |
37.5 |
2.5 |
|
Barcelona |
79.7 |
4.4 |
No |
Tourism, logistics, pharmaceuticals, automotive, food and beverages processing, ICT, and creative industries; chemicals and plastics, motor vehicles, and life sciences -- much stronger on Tourism |
42.7 |
2.0 |
|
Budapest |
80.94 |
-6.13 |
No |
Manufacturing (automotive, electronics), tourism, finance, and ICT -- growing tourism sector, less focus on traditional industries |
40.9 |
2.0 |
|
Vancouver |
83.32 |
0.56 |
No |
Natural resources (forestry, mining), tourism, film production, technology -- stronger focus on natural resources |
39.7 |
2.0 |
Results and next steps
Based on the analysis above, a qualitative shortlist of places to learn from has been developed. These locations were selected using the five factor analysis and the intuitive insights of colleagues working on an economic theory of change for the West Midlands:
- Lille, France: although the rate of growth in Lille has not exceeded that of France overall, labour productivity in France well exceeds that of the UK, and there are lessons to be learned. While other places, e.g., Lyon, also exhibit some similarities to the WMCA area, Lille is more similar due to its polycentric nature, and a median age that is even younger than Birmingham’s. Additionally, Lille is connected to London and Paris via Eurostar; similar to the potential gains of HS2 for Birmingham.
- Greater Porto, Portugal: Porto scores similar to WMCA, is polycentric, and has similarities in its industrial clusters around ICT, automotive. It also plays the role of a “second city” to Lisbon, similar to the West Midland’s role in relation to London.
- Saxony, Germany: of the German regions, Saxony has seen growth exceeding the national average in 2010 to 2019, as the former East Germany states catch-up. The growth rates in other similar places – notably the Ruhrgebiet – has been below the German average in that period; while another potential comparator, the international Meuse-Rhine region, has significantly different governmental set-ups that make it a less appropriate comparator.
- Lombardy, Italy: the region exhibits a very high similarity score, is polycentric (Milan-Bergamo-Brescia), and has similarities in its industrial composition. While its regional productivity growth rate, with the exception of Brescia, has lagged behind the average Italian growth rate, there are potentially lessons for both the WMCA area and Lombardy as it seeks to return to growth.
As a set of “international” (rather than just European) comparators, we also took a decision to include some places that are, perhaps, less familiar. The intention is to identify one area in Mexico, and one area in Japan – however, a desktop analysis alone is unable to ascertain which is the best comparator. For that reason, we have included two for each, with a view that a future “phase 2” piece of work would include consideration as to which might be added to the comparator cohort. The areas shortlisted are:
- Guadalajara, Mexico OR Monterrey, Mexico: both areas are outstanding comparators for the WMCA area, as they score highly in terms of its similarity to the WMCA area, as well as its regional growth rate versus the Mexican average in 2010-2019. Their focus on manufacturing industries – as well as growing tertiary industries in ICT and finance – make them good comparators for the WMCA area too. Furthermore, both city-regions are polycentric (indeed, Guadalajara is made up of two Birmingham-sized cities, and three cities of 500k), and have a relatively young population. Of note – Monterrey is the chosen site for a Tesla Gigafactory – perhaps playing a similar role to Coventry’s proposed ‘Greenpower’ Giga Park – although Elon Musk has currently paused this investment as it assesses the impact of President Donald Trump’s tariffs on electric vehicles manufactured outside of the United States.
- Sapporo, Japan OR Okayama, Japan: both areas are polycentric regions that play an important role in their regional economy. While Osaka may be the more ‘obvious’ (and also polycentric) ‘second city’ comparator – and indeed, like Birmingham, it was the industrial centre in the 19th century and early 20th century, it does not feature in our analysis because its ‘similarity’ score in our quantitative analysis suggests that it is less similar than Sapporo or Okayama; and importantly, its growth rate between 2010-2019 has lagged the Japanese average. There are reasons to include both Sapporo and Okayama – Okayama perhaps is more similar because it is on the largest of the four main islands of Japan – Honshū island – although Sapporo has perhaps more similar industries to the WMCA area.
This study has been produced by the West Midlands Combined Authority.
|
|
Research, Intelligence, and Inclusive Growth Team |
|
Research Lead |
|
|
|
Si Chun Lam Head of Research, Intelligence, and Inclusive Growth |
|
Research Team |
|
|
|
Michael Amery Strategic Lead for Policy & Devolution |
|
|
Madiyha Ghafoor Senior Policy Officer, Inclusive Growth |
|
|
Dr Phillip Nelson Senior Research Officer |
|
|
Tawfieq Zakria Trainee Data Scientist |