Types of metrics
There are two types of metrics that are being used to track the regions progress towards achieving Inclusive Growth:
Attainment metrics
These measures will be used to track the extent to which the region is achieving inclusive growth. They will be monitored on an annual basis to ensure that we can track our progress towards the fundamentals.
Progress metrics
These metrics are intended to provide further context in relation to each of the fundamentals and associated policy themes. They will allow us to ensure that the interventions we are taking are addressing the problems they should be for those most in need.
Some of these metrics are very close to the attainment metric for the same fundamental. We will look to refresh these more frequently than the attainment metrics, reflecting activities in the region.
Metrics by fundamental
Climate and environment
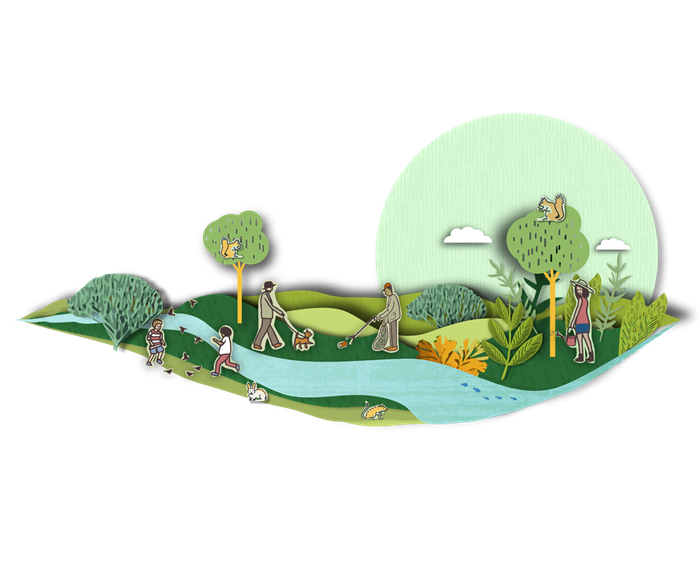
Attainment
- Total carbon emissions
- Greenhouse gas emissions (CO2, CH4, and N2O) per capita
- Proportion of household waste sent to landfill
Progress
- Renewable energy
- Emissions
- Emissions intensity ratio
- Domestic gas consumption
- Domestic electricity consumption
- Median consumption of domestic gas
- Recycling rates
- Total local authority collected waste incinerated with energy from waste
Inclusive economy
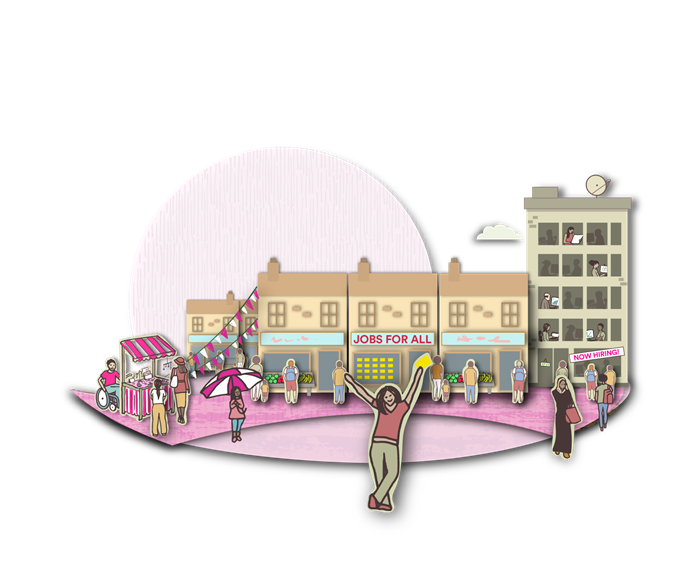
Attainment
- Gross domestic product (GDP) per capita
- Gross domestic household income (GDHI) per head of population
- Proportion of the population who are employees (aged 16-64) in WMCA area
- Overall business creation and survival
- Proportion of income spent on essentials
Progress
- Gross value added (GVA) per hour worked
- Percentage of people on zero hours contracts
- Youth claimant rates as a proportion of 16 to 24-year-olds in the WMCA area
- Proportion of the population who are economically inactive: long-term sick
Power and participation
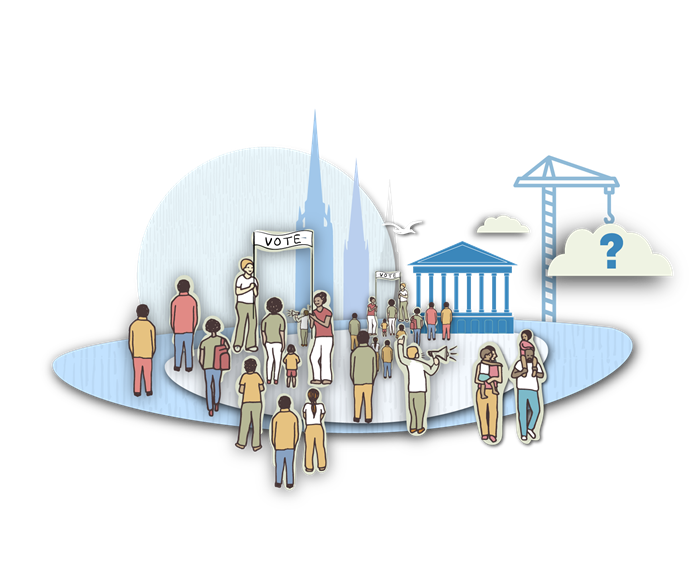
Attainment
- Turnout in local elections
- Proportion of people who have engaged in some form of civic participation in the last 12 months, such as, contacting their local Member of Parliament (MP), councillor, attended a public meeting or signed a petition
Progress
- Turnout in national elections
- Engagement in protests, marches, volunteering etc.
- Proportion of people who agree that they can influence decisions affecting their local area
- Proportion of residents satisfied with their local authority
Affordable and safe places
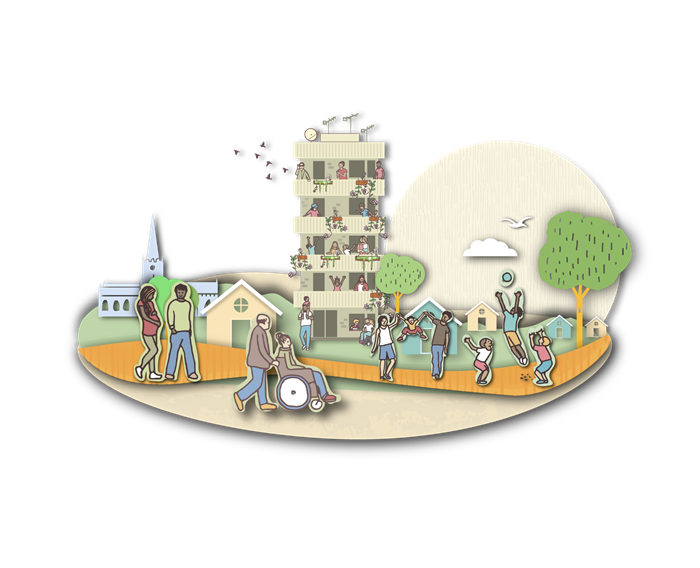
Attainment
- Population density
- Expenditure on essentials
- Rates of homelessness
- Perception of safety
Progress
- Percentage of affordable housing
- Rent as a proportion of Income
- Percentage of fuel poor households
- Rates of homelessness for families with children in temporary accommodation
- Rates of homelessness, for instance, people living with friends or family, sleeping rough, etc.
- Experiences of harassment
- Hate crime reporting
- People killed or seriously injured in road traffic incidents
Connected communities
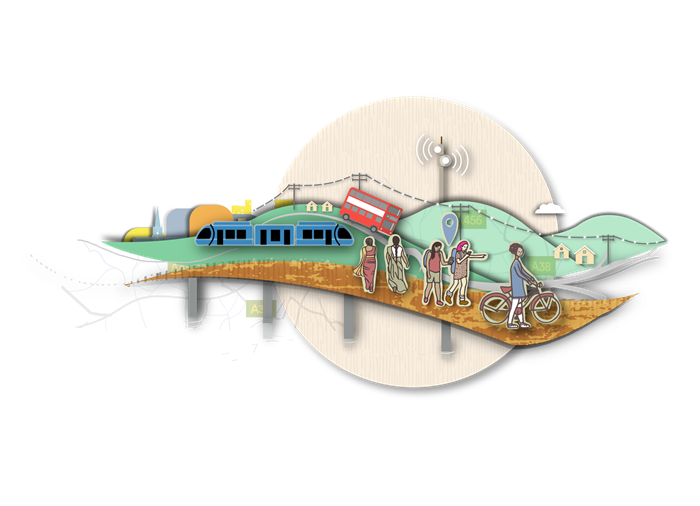
Attainment
- Percentage of population that can access at least three strategic centres within 45 minutes public transport journey time
- Proportion of adults who walk or cycle for at least five journeys a week
- Risk or likelihood of digital exclusion for the WMCA area
- Strength of feelings of belonging to their immediate neighbourhood amongst people aged 16 or over
Progress
- Access to local amenities, including post offices, cashpoints and parks
- Percentage increase in the population within an acceptable walking distance of a public transport mode
- Gigabit broadband internet connectivity
- Percentage of population with 5G coverage
Education and learning
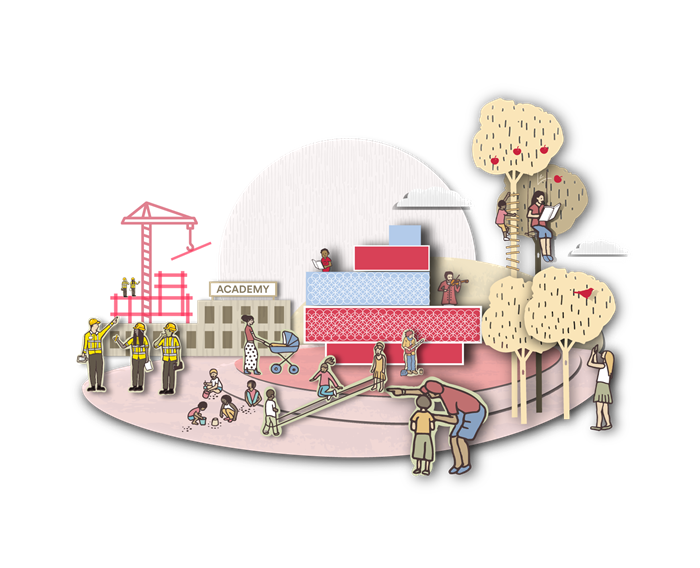
Attainment
- Working aged population qualified to level 3 or above
- Apprenticeship completion rates
- Children with both English and Maths at grade 4 and above at GCSE
- Percentage of young people between 16-17 who are not in education, employment, or training (NEET)
Progress
- Working aged population with at least Level 1+
- Achievement of level 2 and 3 qualifications by adults aged 19 plus
- Percentage of employees receiving training in employment in the last 12 months
- Apprenticeship starts
- Percentage of businesses and employers offering training and or skills opportunities
- Attainment 8 and Progress 8
- Free School Meals
- Key Stage 2 readiness (reading, writing, and maths)
- Neighbourhoods of people who are not in education, employment, or training (NEET)
Health and wellbeing
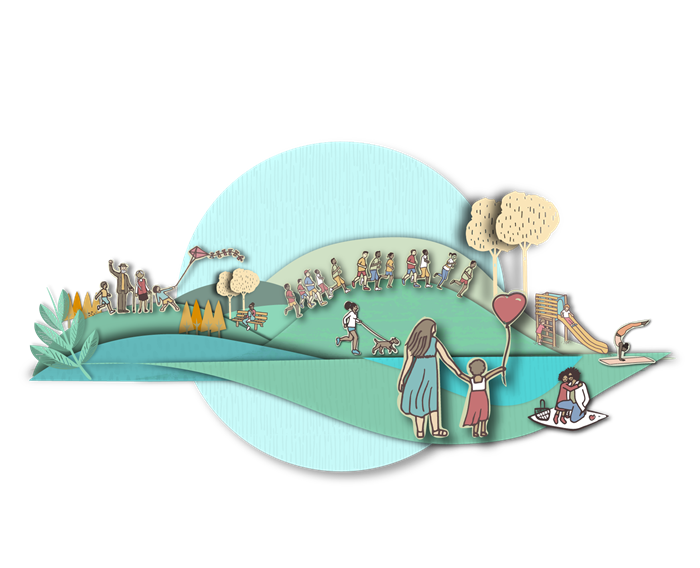
Attainment
- Life expectancy, healthy life expectancy by age and sex
- Life satisfaction
- Mortality from causes considered preventable
Progress
- Inequality in life expectancy at the neighbourhood level
- Social isolation amongst adult social care users (percentage reporting that they have as much social contact as they would like)
- Smoking prevalence in adults
- Percentage of adults classified as obese
- Percentage of children in year 6 who are obese
Equality
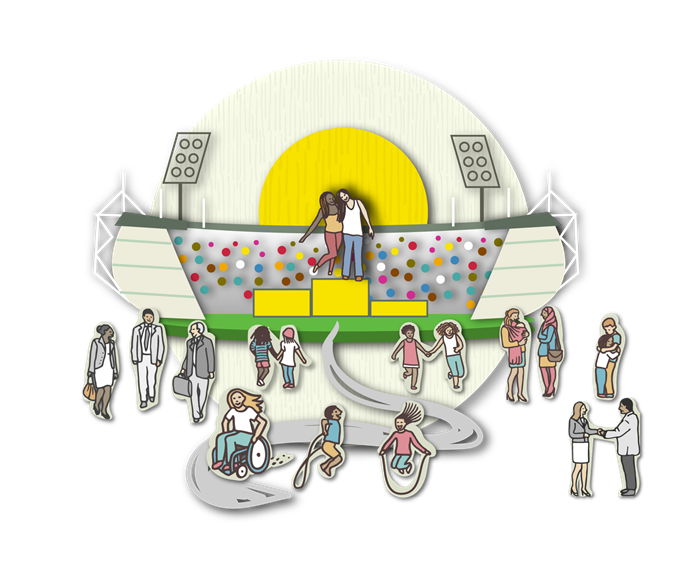
Attainment
- Income inequality in the region
- Childcare costs as a proportion of income
- Hate crime and incidents
Progress
- Gender pay gaps
- Ethnicity pay gaps
- Disability pay and income gaps
